Visualising catchments
Using OS Code-Point with polygons
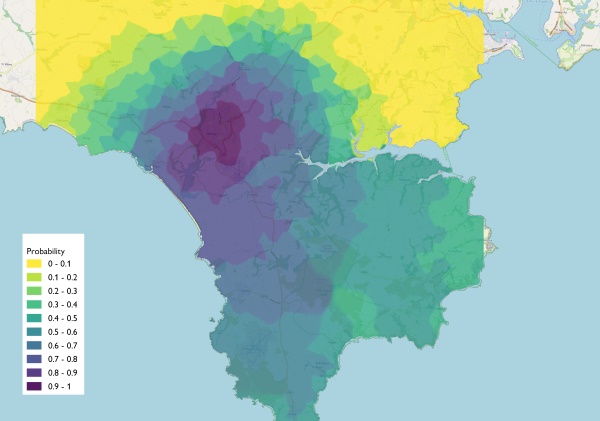
The OS Code-Point with polygons dataset shows the notional shape of every unit postcode in Great Britain. It can be used to visualise a station's probabilistic catchment. An example is shown below:
As OS Code-Point with polygons is not open data, the SDFT does not generate station catchments using it. However, if you have access to the dataset you could use a spatial join to join the postcode centroids' probability attribute to the polygon layer.
Using IDW interpolation in QGIS
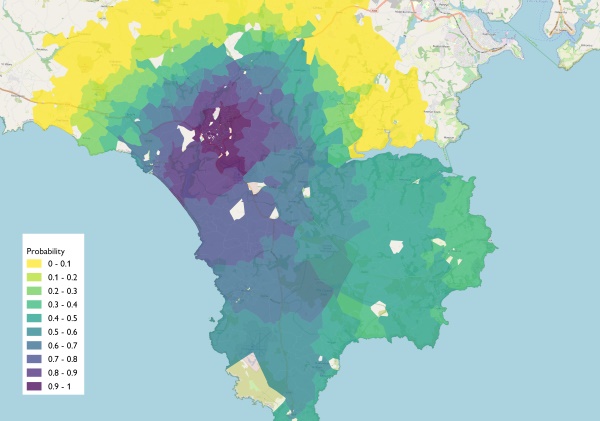
An alternative to using postcode polygons, is to perform an IDW interpolation in a GIS. We have produced good results using the 'IDW Interpolation' algorithm in QGIS. First export the GeoJSON layer to a shapefile (changing the projection to EPSG:27700 at the same time), and then run the 'IDW Interpolation' algorithm with the following settings:
- Distance coefficient: 25
- Extent: set to the catchment layer
- Output raster size: pixel size X: 10; pixel size Y: 10
An example, for the same catchment shown using postcode polygons above, is shown below (raster has been clipped to coastline):